Hotline  +48 34 39 30 015 or +48 601 913 288
  sklep@termipol.pl

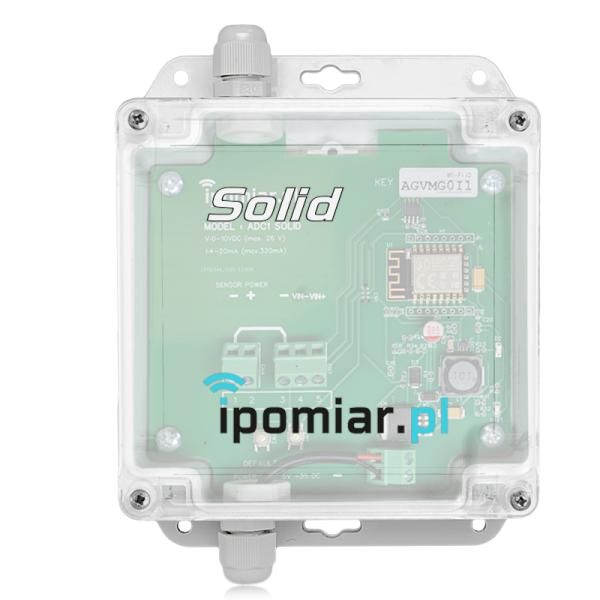

Analog signal recorder ADC1 (power, voltage, current intensity) with Wi-Fi communication.
 Exists
 Payment on delivery, Traditional Bank Transfer (Pro forma), Fast online payments
The product is shipped within 24 hours.
We complete the order within 24 hours.
The product is covered by a one-year warranty.
You can return the product within 14 days.
| Power supply: | 5-24 VDC |
| Accuracy of measurement: | +/- 1% |
| Communication: | Wi-Fi 2,4 GHz |
| Reach: | do 150 m |
| Sensor Service: | 0-10 V, 4-20 mA |
| Sampling: | 1 h, 1 min, 12 h, 15 min, 24 h, 30 min, 30 s |
| Measurement: | Current (mA), Voltage (V) |
| Built-in power source: | 24 VDC |
| Degree of Protection: | IP 65 |
| Internal memory capacity: | do 1000 pomiarów |
| Weight: | 180 g |
| Working Conditions: | -10 ~ 60 °C, < 85% Rh |
| Additional Information: | W zestawie zasilacz sieciowy 24VDC |
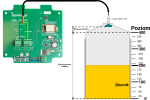
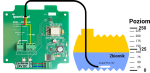
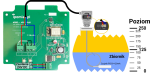
The ADC1 analog signal recorder is a wireless device that allows for the recording of analog values such as power, voltage, current intensity and the transmission of these values directly to the measurement cloud, to the customer's encrypted account. Thanks to the device, it is possible to constantly monitor industrial processes or values measured in home conditions. The module can be used to measure and monitor the level of clean water, rainwater, bulk materials in tanks (e.g. sand, grain), septic tank level, pressure, distance, temperature and any physical values measured by sensors with an analog output. ADC1 reads values such as: power, voltage, current intensity and transmission of these values directly to the measurement cloud, to the customer's encrypted account.

 Fig. ADC1 analog signal recorder - wiring diagram
Thanks to the Premium package service, it is possible to archive measurement data up to 50,000 entries. Measurement data in this package are stored for the entire period of the subscription validity. The Free package allows for storing up to 100 measurement entries for a period of 30 days. The price of the Premium package includes a subscription for one device.
Free |
Premium |
Premium Forever |
|---|---|---|
0 €At the price of
|
79 PLNper year |
139 PLNfor life |
| 100 measurement points memory | Memory 50000 measurement points |
Memory 50000 measurement points |
| Online temperature and humidity preview | Online temperature and humidity preview | Online temperature and humidity preview |
| Alarm Notifications Alarms |
Alarm Notifications Alarms |
|
| Report Generation |
Report Generation |
Short instruction on how to start the iPomiar.pl series device. In the video, we used a tested WiFi temperature recorder RT1 powered by a battery. Thanks to the energy-saving mode, the device is able to work for a period of 6 months on one battery charge. The WiFi temperature recorder RT1 sends data to the server in an encrypted form and only users who log in to individual accounts have access to them.
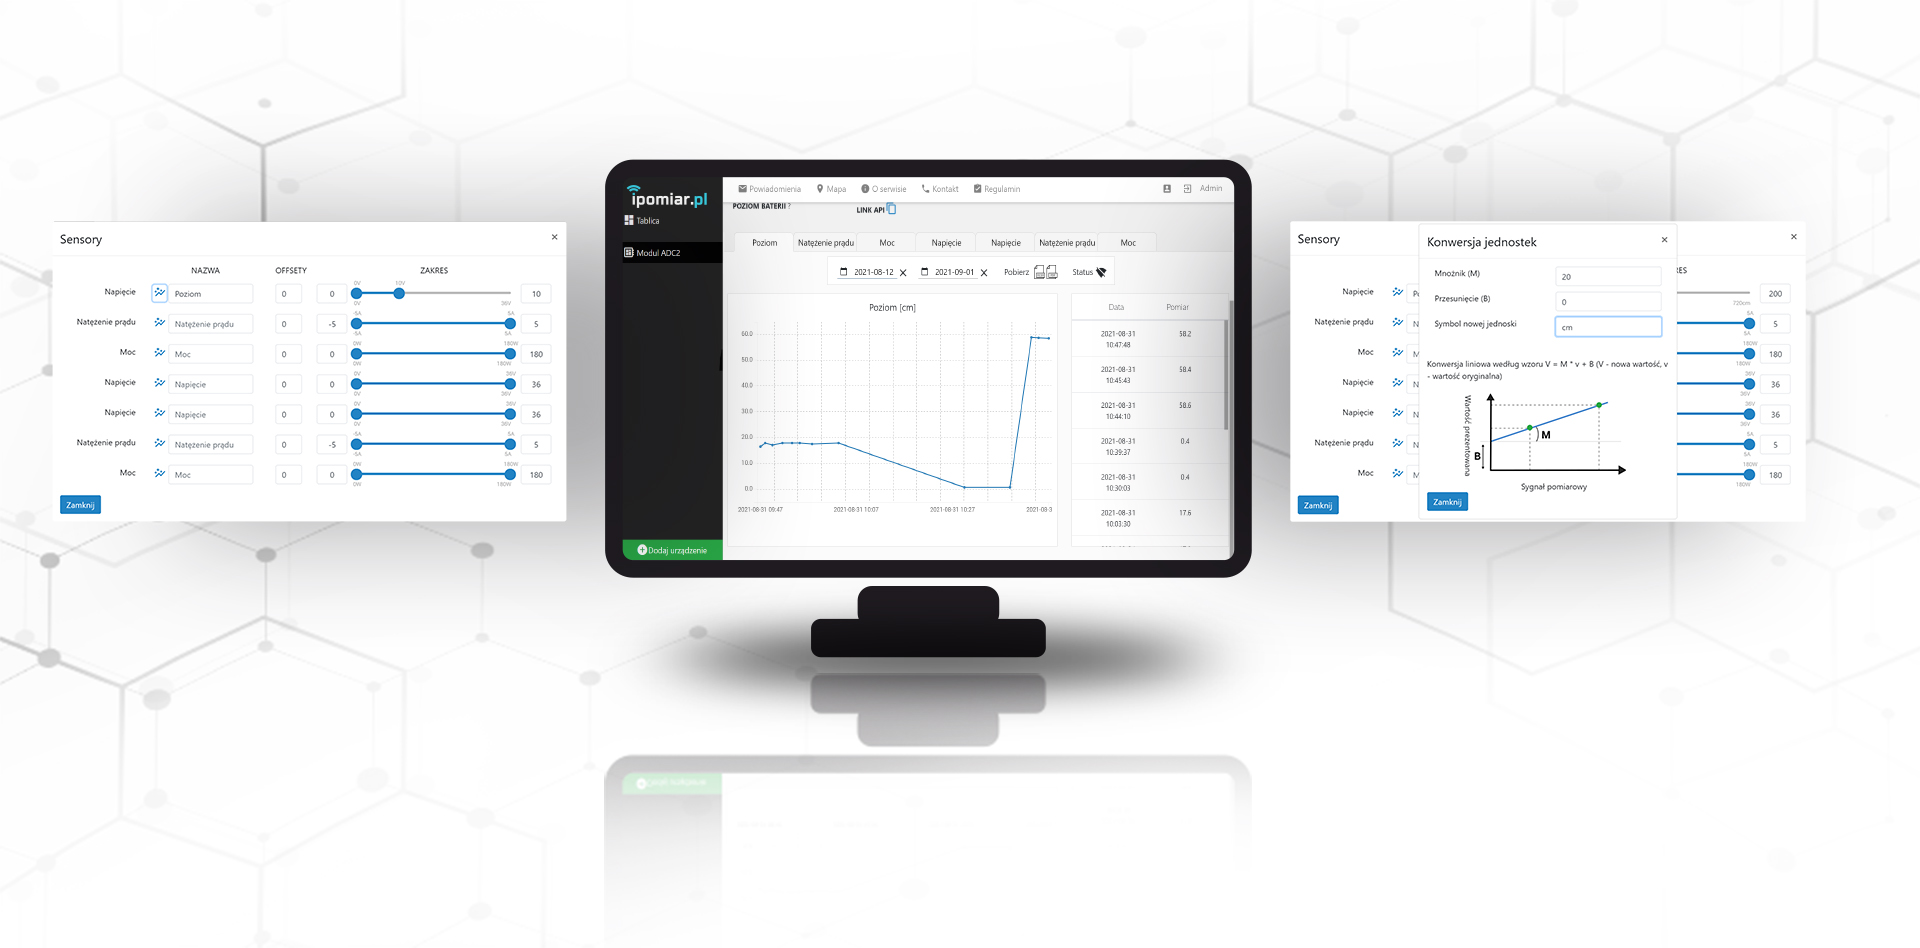
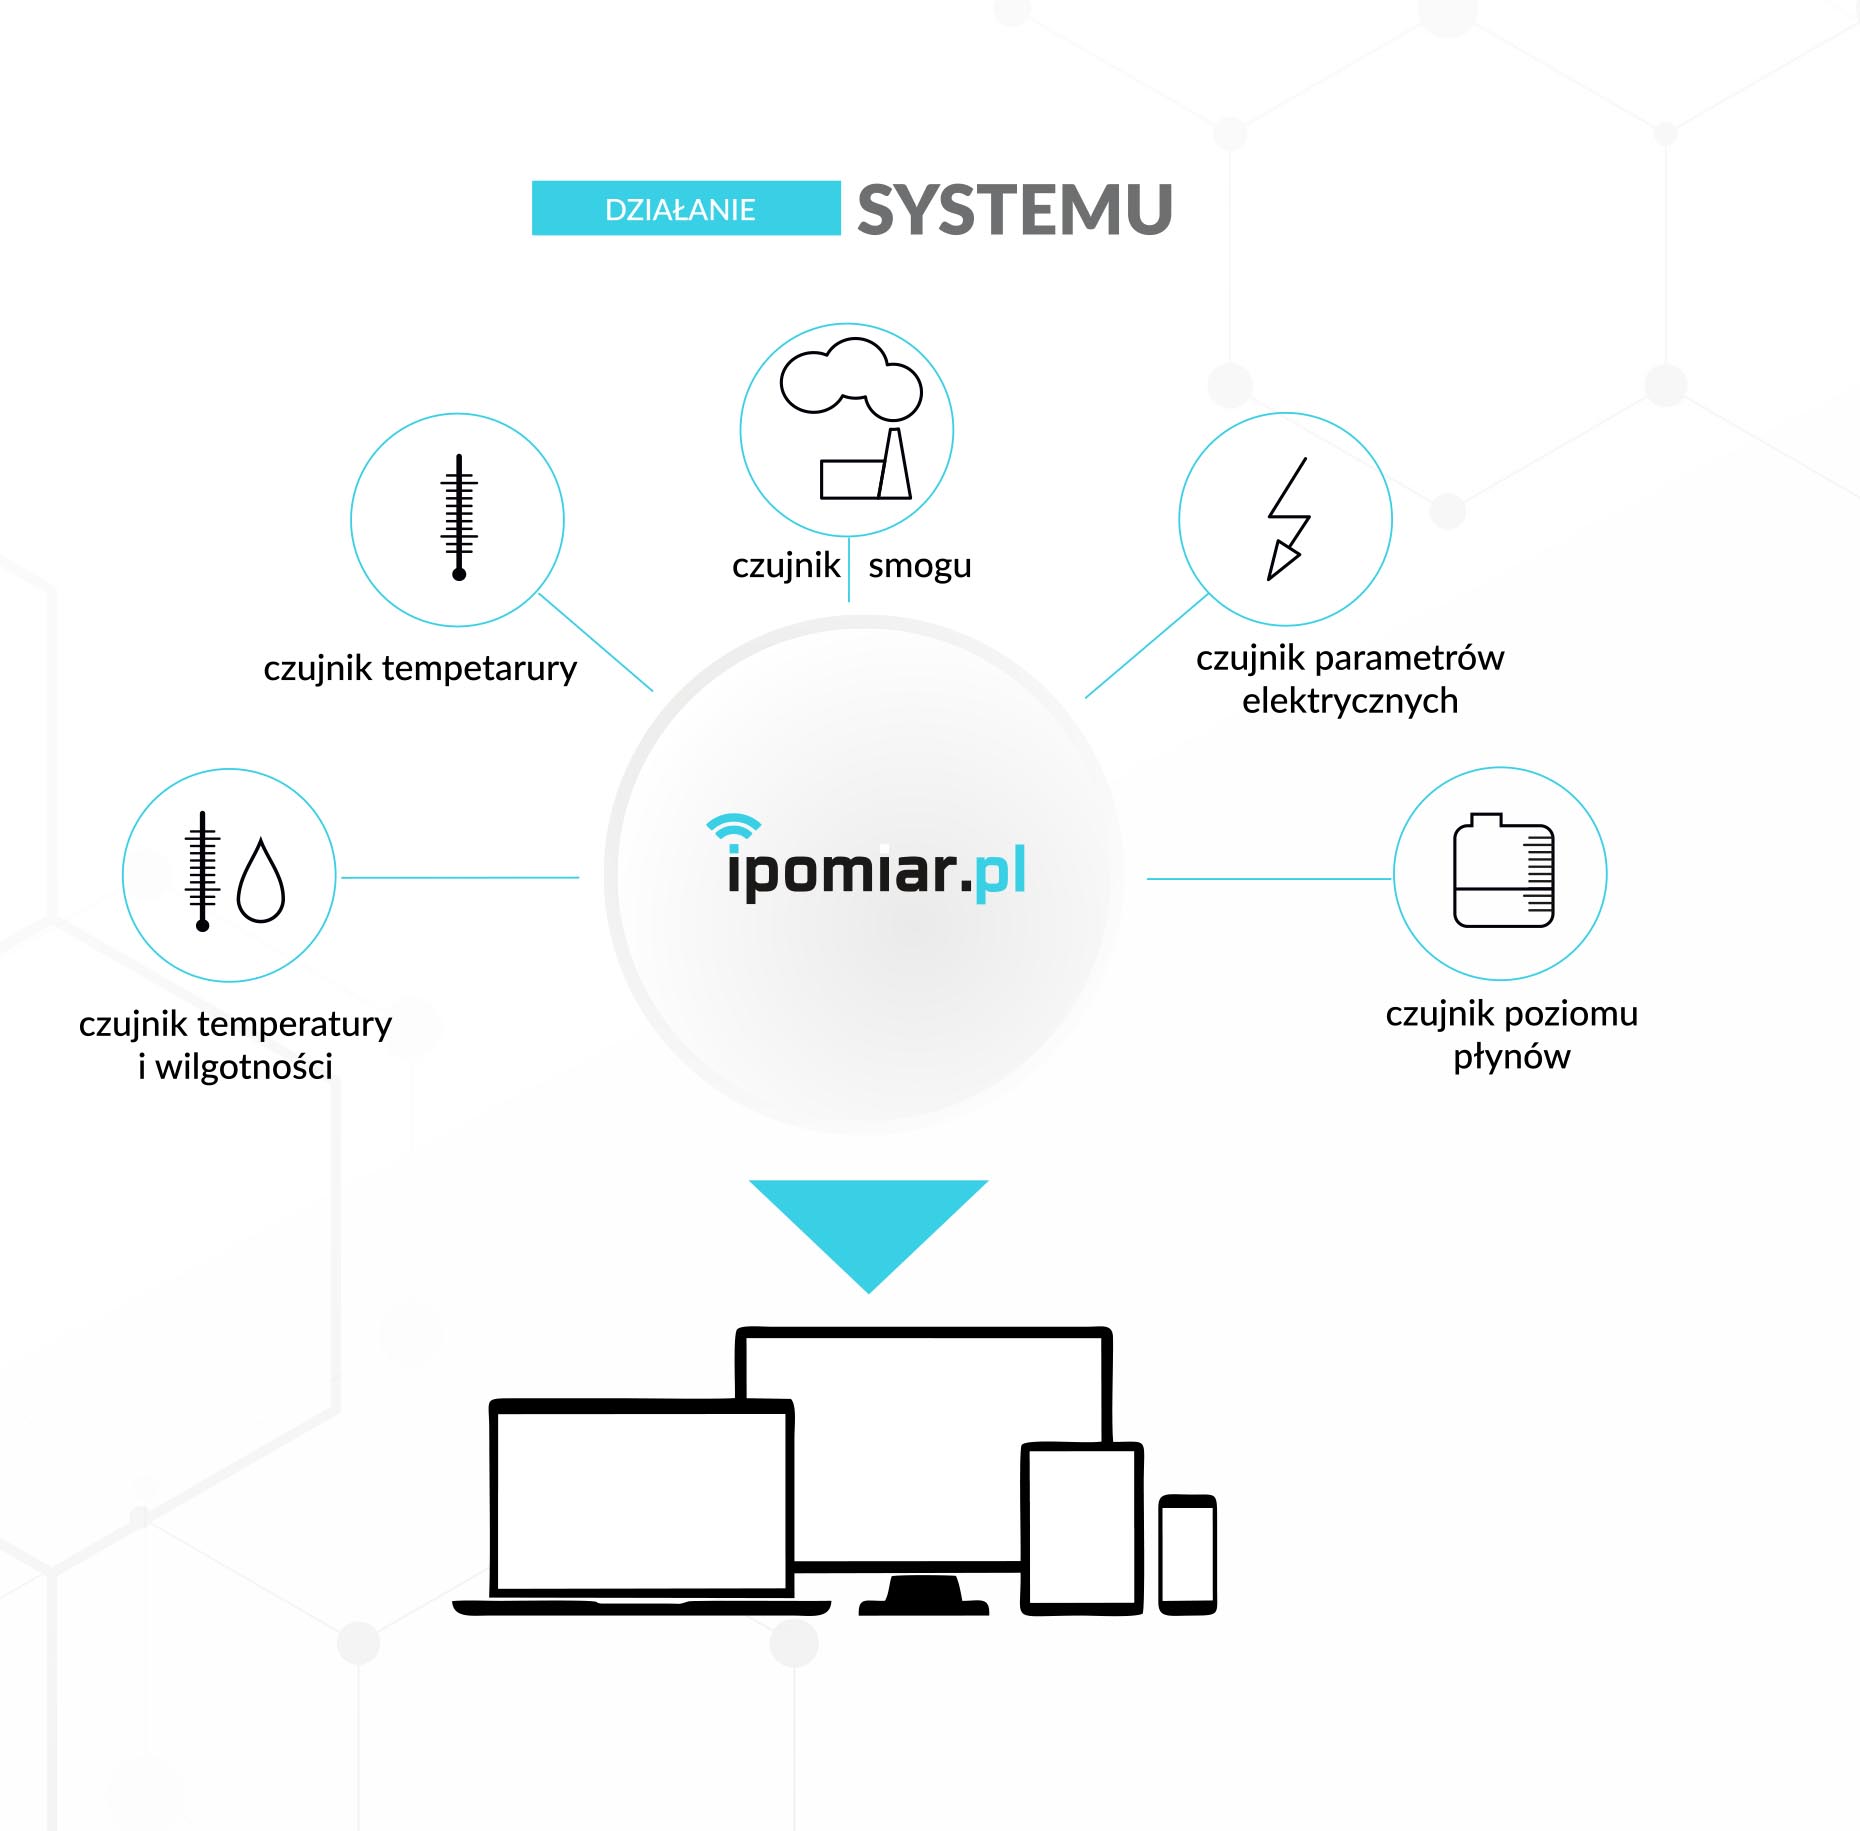
Using the service, you can collect data from devices connected to the Internet. Access to data and product configurations is possible via a web browser or a dedicated mobile application. Additionally, iPomiar.pl allows you to generate reports that easily and clearly illustrate the collected data using charts and tables. The feature that distinguishes the iPomiar.pl platform is direct connection of each sensor to the Wi-Fi network without the need for intermediate base stations - as is the case with Bluetooth communication.

iPomiar.pl is a platform that allows you to monitor and securely collect data from various types of measuring devices online. Access to data and product configurations is available from any location in the world via a web browser.
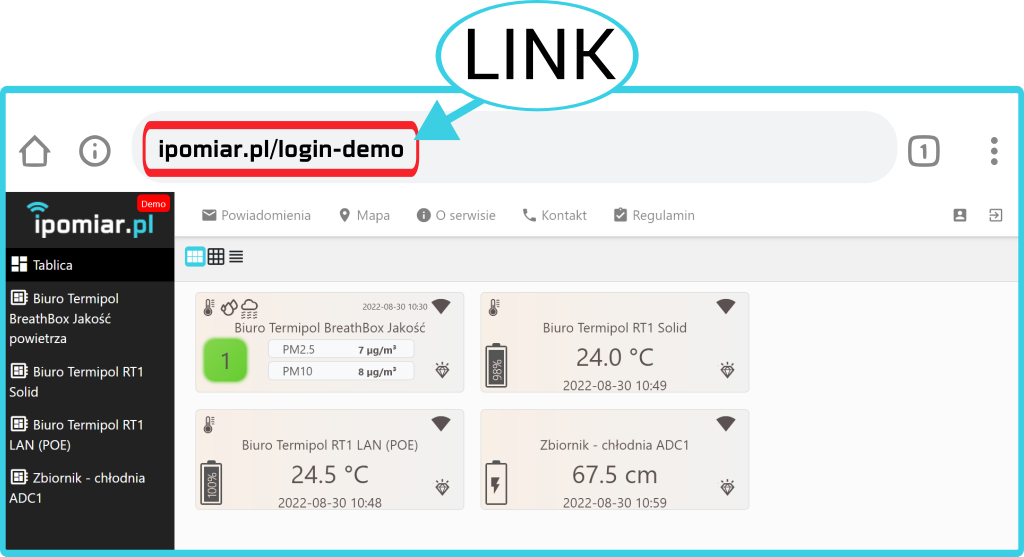
Are you considering buying an iPomiar device but not sure if the service will meet your requirements? We'll show you how the system looks. Click on the link below and check out the DEMO account:
All data in the iPomiar.pl system is encrypted and secured. Each device has its own unique ID number available to the user, based on which it is registered in the system.
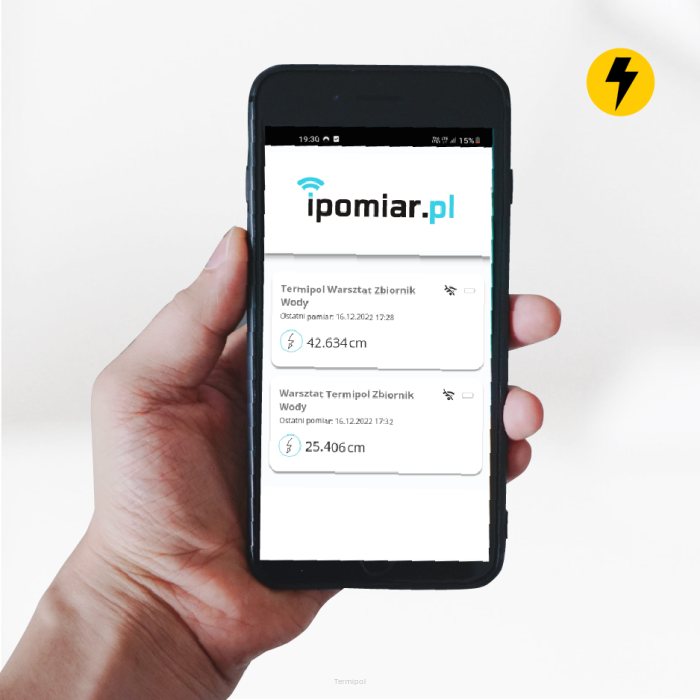
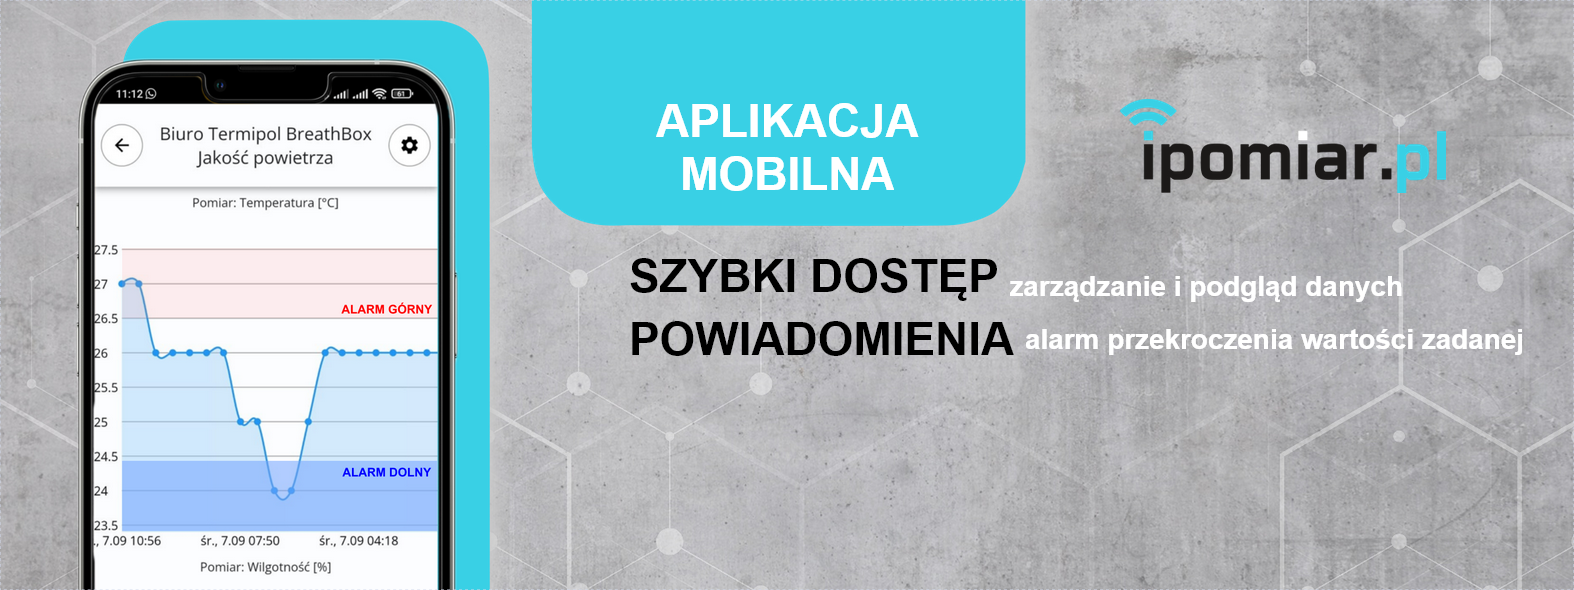
The free mobile device application allows quick access to data sent by devices. Thanks to the application, the user can also register new devices and manage those already in the system. In the case of exceeding the upper and lower alarm through the application on the Android phone, push notifications appear, and in the customer panel, the range is signaled by changing the color to red or blue. The device also measures the battery level and, similarly to the alarm temperature, informs the user about the low battery state. Additionally, in the case of losing network connection (router failure) a red indicator inside the device signals an error.


iPomiar.pl is an internet platform that collects data sent by Wi-Fi sensors, with which it is possible to continuously monitor devices connected to the system. Each sensor can be monitored and managed through an online panel or a phone application. The user can use one application that allows them to manage all devices collectively from any place in the world.

The dashboard collecting data from different sensors allows collective monitoring of different devices.
iPomiar devices send data to individual user accounts. This data is stored on servers and archived. Access to archived measurements is possible at all times, and the period and amount of space on the account and the time of data recording is determined by the customer.
The platform allows you to generate reports remotely using a browser or mobile application. The user determines from which period the data should be downloaded and in what form the report should be generated.
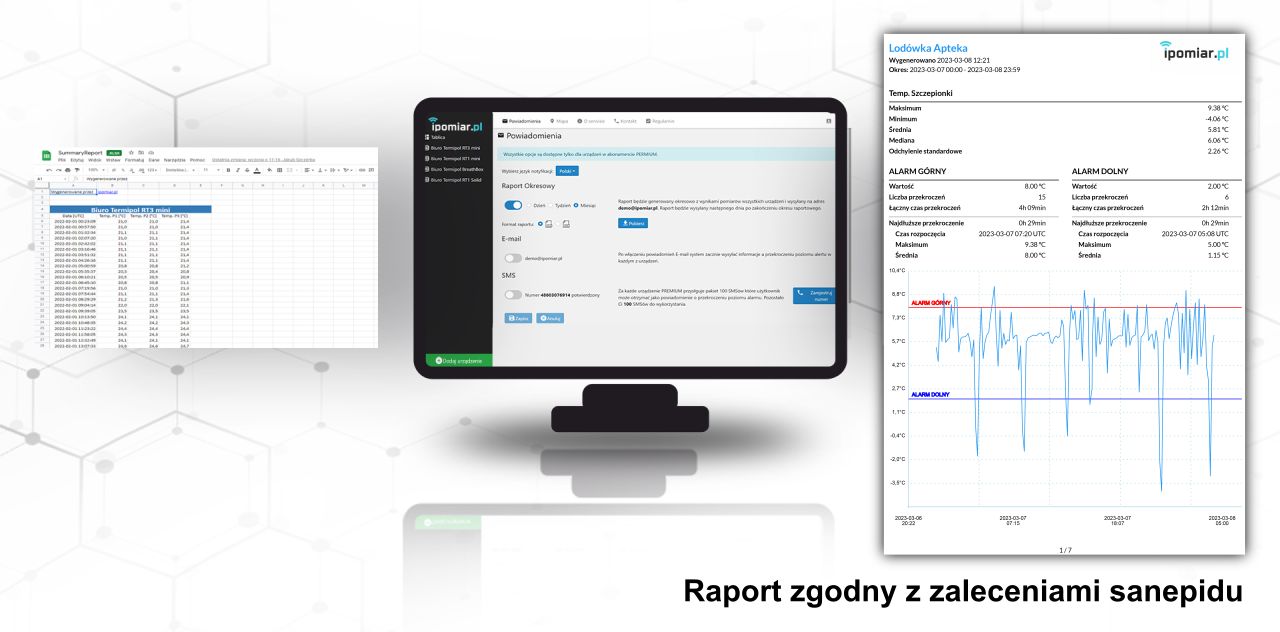
View of report settings in the iPomiar.pl platform
Thanks to the extended user panel, it is possible to analyze measurement data presented in the form of charts or tables. Additionally, there is the possibility of generating reports from a specific time range.